|
This version is still in development and is not considered stable yet. For the latest stable version, please use Micrometer 1.17.0! |
Micrometer Prometheus
Prometheus is a dimensional time series database with a built-in UI, a custom query language, and math operations. Prometheus is designed to operate on a pull model, periodically scraping metrics from application instances, based on service discovery.
Micrometer uses the Prometheus Java Client under the hood; there are two versions of it and Micrometer supports both. If you want to use the "new" client (1.x), use micrometer-registry-prometheus but if you want to use the "legacy" client (0.x), use micrometer-registry-prometheus-simpleclient.
1. Installing micrometer-registry-prometheus
It is recommended to use the BOM provided by Micrometer (or your framework if any), you can see how to configure it here. The examples below assume you are using a BOM.
1.1. Gradle
After the BOM is configured, add the following dependency:
implementation 'io.micrometer:micrometer-registry-prometheus'| The version is not needed for this dependency since it is defined by the BOM. |
1.2. Maven
After the BOM is configured, add the following dependency:
<dependency>
  <groupId>io.micrometer</groupId>
  <artifactId>micrometer-registry-prometheus</artifactId>
</dependency>| The version is not needed for this dependency since it is defined by the BOM. |
2. Installing micrometer-registry-prometheus-simpleclient
It is recommended to use the BOM provided by Micrometer (or your framework if any), you can see how to configure it here. The examples below assume you are using a BOM.
2.1. Gradle
After the BOM is configured, add the following dependency:
implementation 'io.micrometer:micrometer-registry-prometheus-simpleclient'| The version is not needed for this dependency since it is defined by the BOM. |
2.2. Maven
After the BOM is configured, add the following dependency:
<dependency>
  <groupId>io.micrometer</groupId>
  <artifactId>micrometer-registry-prometheus-simpleclient</artifactId>
</dependency>| The version is not needed for this dependency since it is defined by the BOM. |
3. Configuring
Prometheus expects to scrape or poll individual application instances for metrics. In addition to creating a Prometheus registry, you also need to expose an HTTP endpoint to Prometheus’s scraper. In a Spring Boot application, a Prometheus actuator endpoint is auto-configured in the presence of Spring Boot Actuator. Otherwise, you can use any JVM-based HTTP server implementation to expose scrape data to Prometheus.
The following example uses the JDK’s com.sun.net.httpserver.HttpServer to expose a scrape endpoint:
PrometheusMeterRegistry prometheusRegistry = new PrometheusMeterRegistry(PrometheusConfig.DEFAULT);

try {
    HttpServer server = HttpServer.create(new InetSocketAddress(8080), 0);
    server.createContext("/prometheus", httpExchange -> {
        String response = prometheusRegistry.scrape(); (1)
        httpExchange.sendResponseHeaders(200, response.getBytes().length);
        try (OutputStream os = httpExchange.getResponseBody()) {
            os.write(response.getBytes());
        }
    });

    new Thread(server::start).start();
}
catch (IOException e) {
    throw new RuntimeException(e);
}| 1 | The PrometheusMeterRegistry has a scrape() function that knows how to supply the String data necessary for the scrape. All you have to do is wire it to an endpoint. |
If you use the "new" client (micrometer-registry-prometheus), you can alternatively use io.prometheus.metrics.exporter.httpserver.HTTPServer, which you can find in io.prometheus:prometheus-metrics-exporter-httpserver (you need to add it as a dependency if you want to use it):
PrometheusMeterRegistry prometheusRegistry = new PrometheusMeterRegistry(PrometheusConfig.DEFAULT);
HTTPServer.builder()
    .port(8080)
    .registry(prometheusRegistry.getPrometheusRegistry())
    .buildAndStart();
If you use the "legacy" client (micrometer-registry-prometheus-simpleclient), you can alternatively use io.prometheus.client.exporter.HTTPServer, which you can find in io.prometheus:simpleclient_httpserver:
PrometheusMeterRegistry prometheusRegistry = new PrometheusMeterRegistry(PrometheusConfig.DEFAULT);
// you can set the daemon flag to false if you want the server to block
new HTTPServer(new InetSocketAddress(8080), prometheusRegistry.getPrometheusRegistry(), true);
If you use the "new" client (micrometer-registry-prometheus), another alternative can be io.prometheus.metrics.exporter.servlet.jakarta.PrometheusMetricsServlet, which you can find in io.prometheus:prometheus-metrics-exporter-servlet-jakarta in case your app is running in a servlet container (such as Tomcat):
PrometheusMeterRegistry prometheusRegistry = new PrometheusMeterRegistry(PrometheusConfig.DEFAULT);
HttpServlet servlet = new PrometheusMetricsServlet(prometheusRegistry.getPrometheusRegistry());
If you use the "legacy" client (micrometer-registry-prometheus-simpleclient), another alternative can be io.prometheus.client.exporter.MetricsServlet, which you can find in io.prometheus:simpleclient_servlet in case your app is running in a servlet container (such as Tomcat):
PrometheusMeterRegistry prometheusRegistry = new PrometheusMeterRegistry(PrometheusConfig.DEFAULT);
HttpServlet servlet = new MetricsServlet(prometheusRegistry.getPrometheusRegistry());
3.1. Scrape Format
By default, the PrometheusMeterRegistry scrape() method returns the Prometheus text format.
The OpenMetrics format can also be produced.
To specify the format to be returned, you can pass a content type to the scrape method.
For example, to get the OpenMetrics 1.0.0 format scrape, you could use the Content-Type for it, as follows in case of the "new" client (micrometer-registry-prometheus):
String openMetricsScrape = registry.scrape("application/openmetrics-text");If you use the "legacy" client (micrometer-registry-prometheus-simpleclient), you could use the Prometheus Java client constant for it:
String openMetricsScrape = registry.scrape(TextFormat.CONTENT_TYPE_OPENMETRICS_100);In Spring Boot applications, the Prometheus Actuator endpoint supports scraping in either format, defaulting to the Prometheus text format in the absence of a specific Accept header.
3.2. The Prometheus Rename Filter
In some cases, Micrometer provides instrumentation that overlaps with the commonly used Prometheus simple client modules but has chosen a different naming scheme for consistency and portability. If you wish to use the Prometheus "standard" names, add the following filter:
prometheusRegistry.config().meterFilter(new PrometheusRenameFilter());3.3. Prometheus Client Properties
If you use the "new" client (micrometer-registry-prometheus), you can use some of the properties that the Prometheus Java Client supports, see the Prometheus Java Client Config docs.
These properties can be loaded from any source that is supported by the Prometheus Java Client (Properties file, System properties, etc.) or they can be obtained through Micrometer using PrometheusConfig:
PrometheusConfig config = new PrometheusConfig() {
    @Override
    public String get(String key) {
        return null;
    }

    @Override
    public Properties prometheusProperties() {
        Properties properties = new Properties();
        properties.putAll(PrometheusConfig.super.prometheusProperties()); (1)
        properties.setProperty("io.prometheus.exemplars.sampleIntervalMilliseconds", "1"); (2)
        return properties;
    }
};

PrometheusMeterRegistry registry = new PrometheusMeterRegistry(config, new PrometheusRegistry(), Clock.SYSTEM);| 1 | You can reuse the "default" properties defined in PrometheusConfig. |
| 2 | You can set any property from any property source. |
4. Graphing
This section serves as a quick start to rendering useful representations in Prometheus for metrics originating in Micrometer. See the Prometheus docs for a far more complete reference of what is possible in Prometheus.
4.1. Grafana Dashboard
There are many third-party Grafana dashboards publicly available on GrafanaHub. See an example here.
| The dashboards are maintained by the community in their external GitHub repositories, so if you have an issue, it should be created in their respective GitHub repository. |
4.2. Counters
The query that generates a graph for the random-walk counter is
rate(counter[10s]).
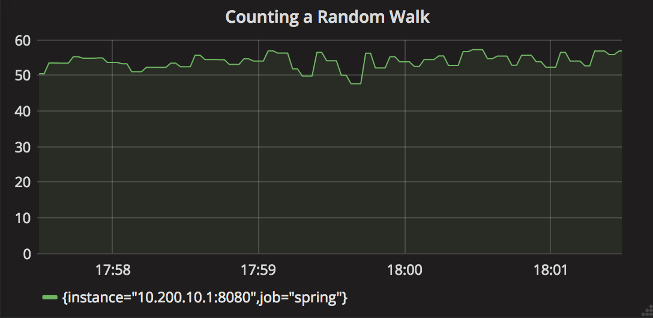
Representing a counter without rate normalization over some time window is rarely useful, as the representation is a function of both the rapidity with which the counter is incremented and the longevity of the service. It is generally most useful to rate-normalize these time series to reason about them. Since Prometheus keeps track of discrete events across all time, it has the advantage of allowing for the selection of an arbitrary time window across which to normalize at query time (for example, rate(counter[10s]) provides a notion of requests per second over 10 second windows). The rate-normalized graph in the preceding image would return back to a value around 55 as soon as the new instance (say on a production deployment) was in service.
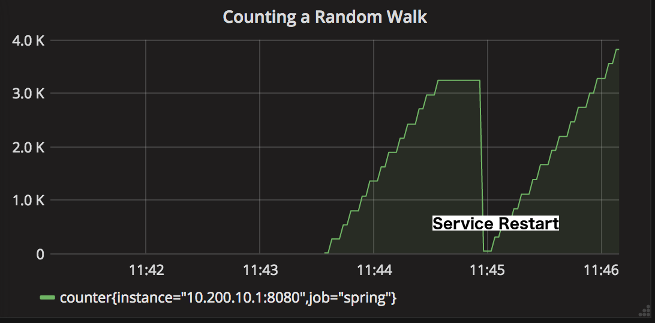
In contrast, without rate normalization, the counter drops back to zero on service restart, and the count increases without bound for the duration of the service’s uptime.
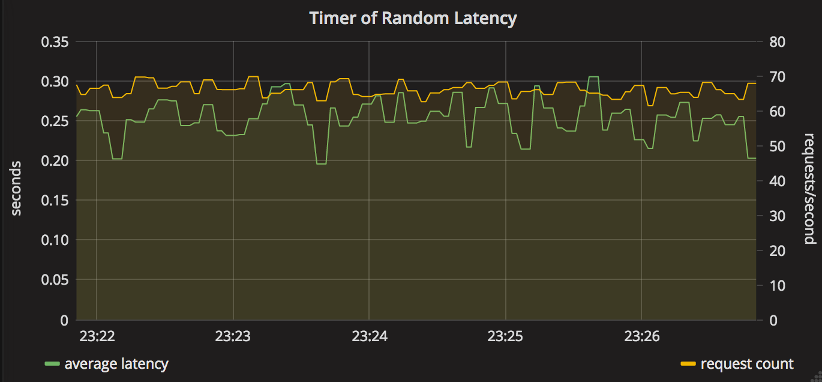
4.3. Timers
The Prometheus Timer produces two counter time series with different names:
-
${name}_count: Total number of all calls. -
${name}_sum: Total time of all calls.
Again, representing a counter without rate normalization over some time window is rarely useful, as the representation is a function of both the rapidity with which the counter is incremented and the longevity of the service.
Using the following Prometheus queries, we can graph the most commonly used statistics about timers:
-
Average latency:
rate(timer_sum[10s])/rate(timer_count[10s]) -
Throughput (requests per second):
rate(timer_count[10s])
5. Limitation on same name with different set of tag keys
The PrometheusMeterRegistry doesn’t allow to create meters having the same name with a different set of tag keys, so you should guarantee that meters having the same name have the same set of tag keys.
Otherwise, subsequent meters having the same name with a different set of tag keys will not be registered silently by default.
This means that you should not do things like:
// Please don't do this
registry.counter("test", "first", "1").increment();
registry.counter("test", "second", "2").increment();
Instead you can do something like this:
registry.counter("test", "first", "1", "second", "none").increment();
registry.counter("test", "first", "none", "second", "2").increment();
You can change the default behavior by registering a meter registration failed listener. For example, you can register a meter registration failed listener that throws an exception as follows:
registry.config().onMeterRegistrationFailed((id, reason) -> {
    throw new IllegalArgumentException(reason);
});
Actually, the PrometheusMeterRegistry has a shortcut for this, so you can do the following to achieve the same:
registry.throwExceptionOnRegistrationFailure();6. Exemplars
Exemplars are metadata that you can attach to the value of your time series. They can reference data outside of your metrics. A common use case is storing tracing information (traceId, spanId). Exemplars are not tags/dimensions (labels in Prometheus terminology), they will not increase cardinality since they belong to the values of the time series.
In order to setup Exemplars for PrometheusMeterRegistry, you will need a component that provides you the tracing information. If you use the "new" client (micrometer-registry-prometheus), this component is the io.prometheus.metrics.tracer.common.SpanContext while if you use the "legacy" client (micrometer-registry-prometheus-simpleclient), it is the SpanContextSupplier.
Setting them up are somewhat similar, if you use the "new" client (micrometer-registry-prometheus):
PrometheusMeterRegistry registry = new PrometheusMeterRegistry(
    PrometheusConfig.DEFAULT,
    new PrometheusRegistry(),
    Clock.SYSTEM,
    new MySpanContext() (1)
);
registry.counter("test").increment();
System.out.println(registry.scrape("application/openmetrics-text"));| 1 | You need to implement SpanContext (class MySpanContext implements SpanContext { … }) or use an implementation that already exists. |
But if you use the "legacy" client (micrometer-registry-prometheus-simpleclient):
PrometheusMeterRegistry registry = new PrometheusMeterRegistry(
    PrometheusConfig.DEFAULT,
    new CollectorRegistry(),
    Clock.SYSTEM,
    new DefaultExemplarSampler(new MySpanContextSupplier()) (1)
);
registry.counter("test").increment();
System.out.println(registry.scrape(TextFormat.CONTENT_TYPE_OPENMETRICS_100));| 1 | You need to implement SpanContextSupplier (class MySpanContextSupplier implements SpanContextSupplier { … }) or use an implementation that already exists. |
If your configuration is correct, you should get something like this, the # {span_id="321",trace_id="123"} … section is the Exemplar right after the value:
# TYPE test counter
# HELP test
test_total 1.0 # {span_id="321",trace_id="123"} 1.0 1713310767.908
# EOF
Exemplars are only supported in the OpenMetrics format (they will not show up in the Prometheus text format). You might need to explicitly ask for the OpenMetrics format, for example:
curl --silent -H 'Accept: application/openmetrics-text; version=1.0.0' localhost:8080/prometheus
