Micrometer SignalFx
| This module has been deprecated in favor of the OTLP Registry because the SignalFX Java client library that this module depends on has been deprecated. |
SignalFx is a dimensional monitoring system SaaS with a full UI that operates on a push model. It has a rich set of alert “detectors”.
1. Installing micrometer-registry-signalfx
It is recommended to use the BOM provided by Micrometer (or your framework if any), you can see how to configure it here. The examples below assume you are using a BOM.
1.1. Gradle
After the BOM is configured, add the following dependency:
implementation 'io.micrometer:micrometer-registry-signalfx'| The version is not needed for this dependency since it is defined by the BOM. |
1.2. Maven
After the BOM is configured, add the following dependency:
<dependency>
  <groupId>io.micrometer</groupId>
  <artifactId>micrometer-registry-signalfx</artifactId>
</dependency>| The version is not needed for this dependency since it is defined by the BOM. |
2. Configuring
The following example configures SignalFx:
SignalFxConfig signalFxConfig = new SignalFxConfig() {
    @Override
    public String accessToken() {
        return "MYTOKEN";
    }

    @Override
    public String get(String k) {
        return null; // accept the rest of the defaults
    }
};

MeterRegistry registry = new SignalFxMeterRegistry(signalFxConfig, Clock.SYSTEM);
There are two distinct sources of API keys in SignalFx.
SignalFxConfig is an interface with a set of default methods. If, in the implementation of get(String k), rather than returning null, you instead bind it to a property source, you can override the default configuration. For example, Micrometer’s Spring Boot support binds properties that are prefixed with management.metrics.export.signalfx directly to the SignalFxConfig:
management.metrics.export.signalfx:
    access-token: MYTOKEN

    # The interval at which metrics are sent to Ganglia. See Duration.parse for the expected format.
    # The default is 1 minute.
    step: 1m
3. Graphing
This section serves as a quick start to rendering useful representations in SignalFx for metrics originating in Micrometer. See the SignalFx docs for a far more complete reference of what is possible in SignalFx.
3.1. Timers
At each publishing interval, the SignalFx Timer produces several time series in SignalFx:
-
${name}.avg: A mean latency for the publishing interval. -
${name}.count: Throughput per second over the publishing interval. -
${name}.totalTime: Total time per second over the publishing interval (used withcount) to create aggregable means. -
${name}.percentiles: Micrometer calculated percentiles for the publishing interval. One time series is produced for each percentile, with a tag ofphiin the range of [0,1]. -
${name}.histogram: One event is produced for each SLO boundary with a tag of 'le', indicating that it represents a cumulative count of events less than or equal to SLO boundaries over the publishing interval.
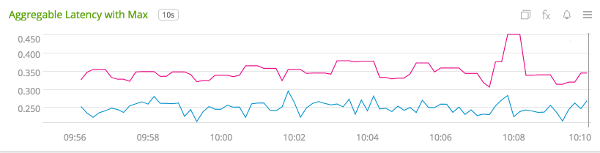
To generate an aggregable view of latency in SignalFx, divide totalTime by count:
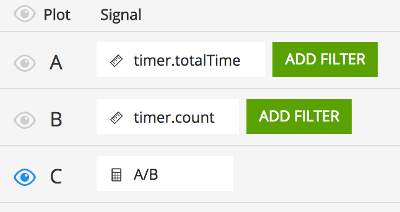
This is accomplished by adding signals for ${name}.totalTime and ${name}.count, adding a formula that divides them, and hiding the inputs to the formula.
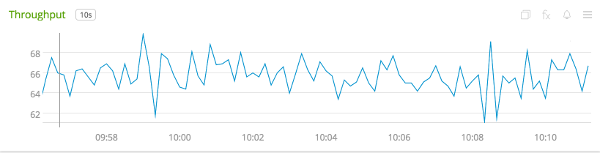
To generate a throughput chart, use the ${name}.count signal:
To generate a plot of client-side percentiles, use the ${name}.percentiles signal:
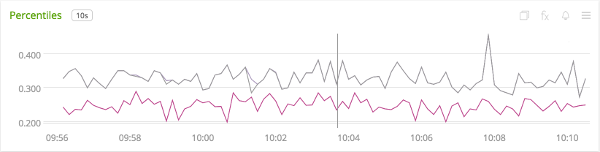
Note that these percentiles are not aggregable. The more dimensions you add to a timer, the less useful these values become.
Finally, if you define SLO boundaries with the fluent builder for Timer, you can view throughput below certain SLO boundaries by using the ${name}.histogram signal. In this example, we set SLO boundaries at 275 (green), 300 (blue), and 500 (purple) milliseconds for a simulated Timer that is recording samples normally distributed around 250 ms. These counts represent the rate/second of samples less than or equal to each SLO boundary.
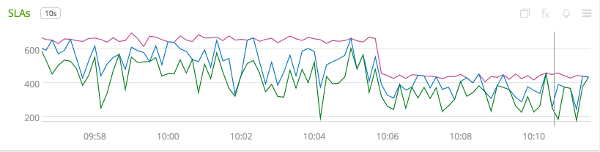
Where the lines converge at various points, it is evident that no sample exceeded the 275 ms SLO boundary.

