Rate Aggregation
Micrometer is aware of whether a particular monitoring system expects rate aggregation to happen client-side before metrics are published or ad-hoc as part of the query on the server. It accumulates metrics according to which style the monitoring system expects.
Not all measurements are reported or best viewed as a rate. For example, gauge values and the active task count long task timers are not rates.
Server-side
Monitoring systems that perform server-side rate math expect absolute values to be reported at each publishing interval. For example, the absolute count of all increments to a counter since the beginning of the application is sent on each publishing interval.
Suppose we have a slightly positively biased random walk that chooses to increment a counter once every 10 milliseconds. If we view the raw counter value in a system like Prometheus, we see a step-wise monotonically increasing function (the width of the step is the interval at which Prometheus is polling or scraping for data).
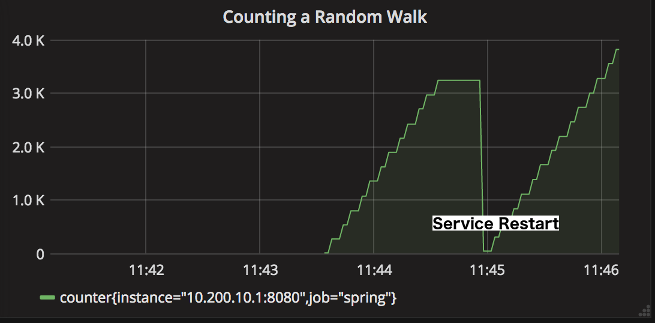
Representing a counter without rate aggregation over some time window is rarely useful, as the representation is a function of both the rapidity with which the counter is incremented and the longevity of the service. In the preceding example, the counter drops back to zero on service restart. The rate-aggregated graph would return back to a value of around 55 as soon as the new instance (say on a production deployment) was in service.
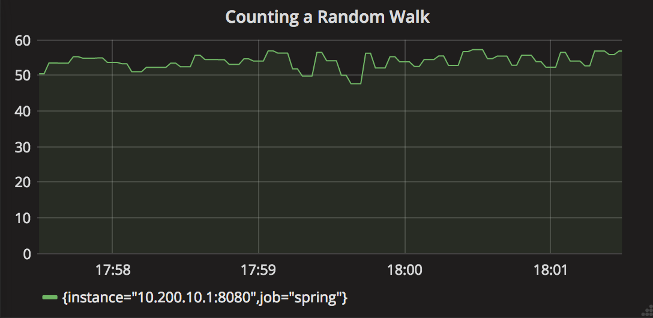
If you have achieved zero-downtime deployments (for example, through red-black deployments), you should be able to comfortably set minimum alert thresholds on the rate-aggregated graph without service restarts causing dips in the counter value.
| For most production purposes, whether it be alerting, automated canary analysis, or other use cases, base your automation off of rate-aggregated data. |
Client-side
Two other classes of monitoring system either:
-
Expect rate-aggregated data. Given the key insight that, for most production purposes, we should be basing our decisions off of rates rather than absolute values. Such systems benefit from having to do less math to satisfy queries.
-
Have relatively little or no math operations that would let us rate-aggregate data through our queries. For these systems, publishing pre-aggregated data is the only way to build meaningful representations.
Micrometer efficiently maintains rate data by means of a step value that accumulates data for the current publishing interval. When the step value is polled (when publishing, for example), if the step value detects that the current interval has elapsed, it moves current data to “previous” state. This previous state is what is reported until the next time current data overwrites it. The following image shows the interaction of current and previous state, along with polling:
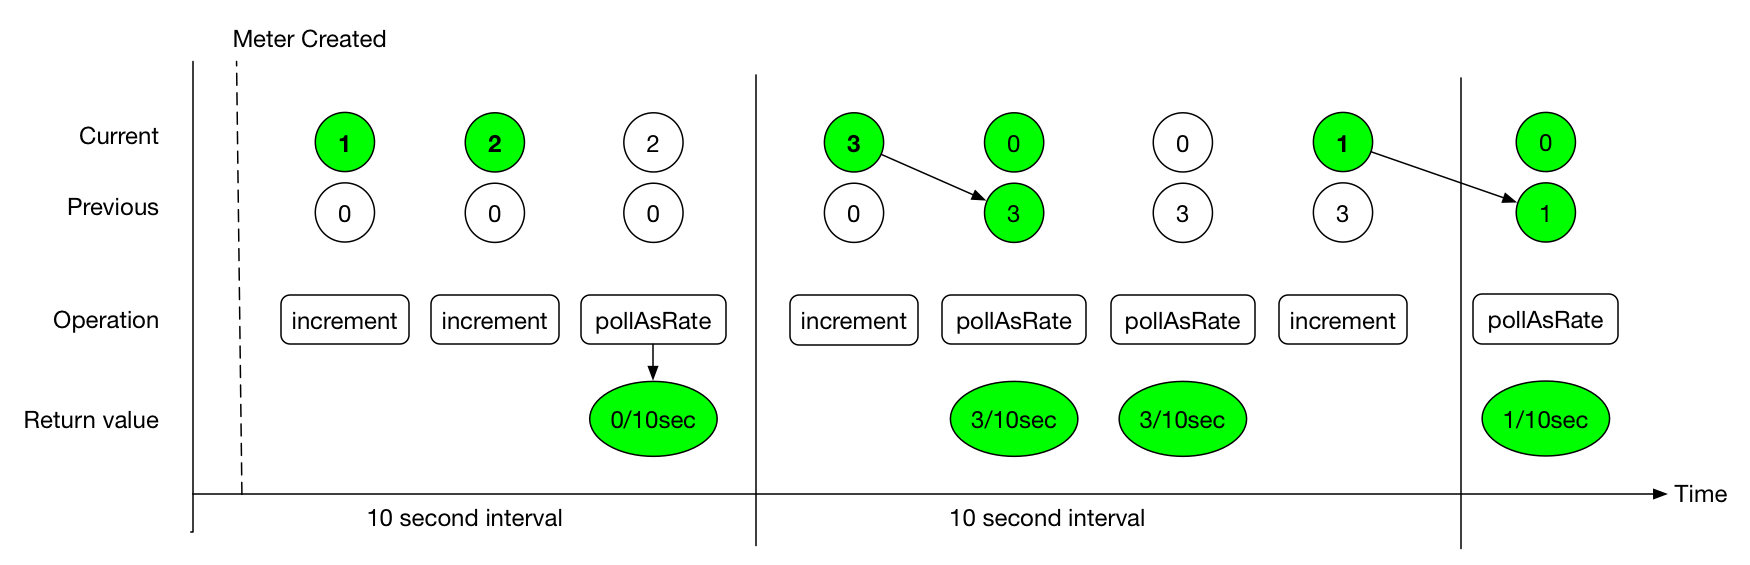
The value returned by the poll function is always rate per second * interval. If the step value shown in the preceding image represents the values of a counter, we could say that the counter saw “0.3 increments per second” in the first interval, which is reportable to the backend at any time during the second interval.
Micrometer timers track at least a count and the total time as separate measurements. Suppose we configure publishing at 10-second intervals and we saw 20 requests that each took 100ms. Then, for the first interval:
-
count= 10 seconds * (20 requests / 10 seconds) = 20 requests -
totalTime= 10 seconds * (20 * 100 ms / 10 seconds) = 2 seconds
The count statistic is meaningful by itself: It is a measure of throughput. totalTime represents the total latency of all requests in the interval. Additionally, consider:
totalTime / count = 2 seconds / 20 requests = 0.1 seconds / request = 100 ms / request
This is a useful measure of average latency. When the same idea is applied to the totalAmount and count emanating from distribution summaries, the measure is called a distribution average. Average latency is just the distribution average for a distribution summary measured in time (a timer). Some monitoring systems (such as Atlas) provide facilities for computing the distribution average from these statistics, and Micrometer includes totalTime and count as separate statistics. Others, (such as Datadog) do not have this kind of operation built-in, and Micrometer calculates the distribution average client-side and ships that.
Shipping the rate for the publishing interval is sufficient to reason about the rate over any time window greater than or equal to the publishing interval. In our example, if a service continues to receive 20 requests that each take 100ms for every 10 second interval in a given minute, we could say:
-
Micrometer reported “20 requests” for
counton every 10-second interval. The monitoring system sums these six 10-second intervals and arrives at the conclusion that there are 120 requests / minute. Note that it is the monitoring system doing this summation, not Micrometer. -
Micrometer reported “2 seconds” of
totalTimeon every 10 second interval. The monitoring system can sum all total time statistics over the minute to yield “12 seconds” of total time in the minute interval. Then, the average latency is as we expect: 12 seconds / 120 requests = 100 ms / request.

