Micrometer New Relic
New Relic offers a dimensional monitoring system product called Insights. It includes a full UI and a query language called NRQL. New Relic Insights operates on a push model. Some features of NRQL assume that Insights receives a distinct event payload for every timing, count, and so on. Micrometer instead ships aggregates at a prescribed interval, letting your app’s throughput scale without concern for event propagation to Insights becoming a bottleneck.
New Relic provides its own Micrometer MeterRegistry implementation based on dimensional metrics.
It intends to supersede Micrometer’s NewRelicMeterRegistry (which uses custom events in New Relic), because New Relic’s dimensional metrics are a better fit for metrics than custom events.
You can find more details in its GitHub repository.
|
1. Installing micrometer-registry-new-relic
It is recommended to use the BOM provided by Micrometer (or your framework if any), you can see how to configure it here. The examples below assume you are using a BOM.
1.1. Gradle
After the BOM is configured, add the following dependency:
implementation 'io.micrometer:micrometer-registry-new-relic'| The version is not needed for this dependency since it is defined by the BOM. |
1.2. Maven
After the BOM is configured, add the following dependency:
<dependency>
  <groupId>io.micrometer</groupId>
  <artifactId>micrometer-registry-new-relic</artifactId>
</dependency>| The version is not needed for this dependency since it is defined by the BOM. |
2. Configuring
The following example configures New Relic:
NewRelicConfig newRelicConfig = new NewRelicConfig() {
    @Override
    public String accountId() {
        return "MYACCOUNT";
    }

    @Override
    public String apiKey() {
        return "MY_INSIGHTS_API_KEY";
    }

    @Override
    public String get(String k) {
        return null; // accept the rest of the defaults
    }
};

MeterRegistry registry = new NewRelicMeterRegistry(newRelicConfig, Clock.SYSTEM);
There are two distinct sources of API keys in New Relic.
NewRelicConfig is an interface with a set of default methods. If, in the implementation of get(String k), rather than returning null, you instead bind it to a property source, you can override the default configuration. For example, Micrometer’s Spring Boot support binds properties that are prefixed with management.metrics.export.newrelic directly to the NewRelicConfig:
management.metrics.export.newrelic:
    account-id: MYACCOUNT
    api-key: MY_INSIGHTS_API_KEY

    # The interval at which metrics are sent to New Relic. See Duration.parse for the expected format.
    # The default is 1 minute.
    step: 1m
3. Graphing
This section serves as a quick start to rendering useful representations in New Relic for metrics originating in Micrometer. See the New Relic NRQL docs for a far more complete reference of what is possible in New Relic.
3.1. Timers
At each publishing interval, the New Relic Timer produces a single event with the timer’s name and several attributes:
-
avg: A mean latency for the publishing interval. -
count: Throughput per second over the publishing interval. -
totalTime: Total time per second over the publishing interval (used withcount) to create aggregable means.
Additionally, if any percentiles or SLO buckets are defined on the timer, additional events are produced:
-
${name}.percentiles: Micrometer calculated percentiles for the publishing interval. One event is produced for each percentile, with a tag ofphiin the range of [0,1]. -
${name}.histogram: One event is produced for each SLO boundary with a tag of 'le', indicating that it represents a cumulative count of events less than or equal to SLO boundaries over the publishing interval.
To generate an aggregable view of latency in New Relic, divide totalTime by count:
SELECT sum(totalTime)/sum(count) as 'Average Latency', max(max) as 'Max' FROM timer since 30 minutes ago TIMESERIES auto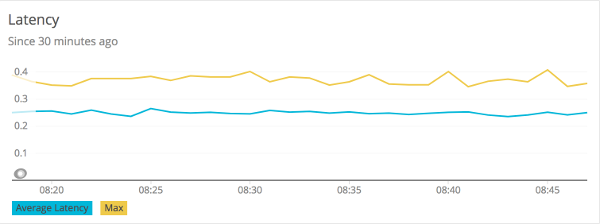
The following example generates a throughput chart:
SELECT average(count) as 'Average Throughput' FROM timer since 30 minutes ago TIMESERIES auto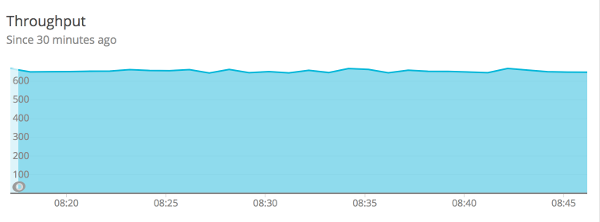
The following example generates a plot of client-side percentiles:
SELECT latest(value) from timerPercentile FACET phi since 30 minutes ago TIMESERIES auto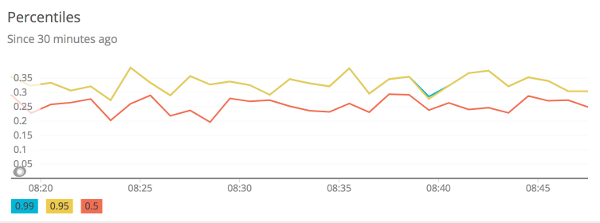
Note how these percentiles are not aggregable. We have selected the latest(value) function to display this chart (it is not correct to average(value) on a percentile value). The more dimensions you add to a timer, the less useful these values become.
Finally, if you define SLO boundaries with the fluent builder for Timer, you can view throughput below certain SLO boundaries. In this example, we set SLO boundaries at 275 (yellow), 300 (red), and 500 (blue) milliseconds for a simulated Timer that is recording samples normally distributed around 250 ms. These counts represent the rate/second of samples less than or equal to each SLO boundary.
SELECT sum(value) from timerHistogram FACET le since 30 minutes ago TIMESERIES auto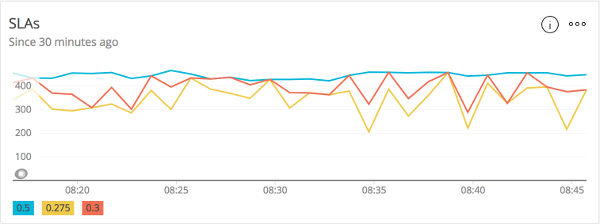
Where the lines converge at various points, it is evident that no sample exceeded the 275 ms SLO boundary.

