Micrometer Atlas
Atlas is an in-memory dimensional time series database with built-in graphing, a custom stack-based query language, and advanced math operations. Atlas originated at Netflix, where it remains the operational metrics solution.
1. Installing micrometer-registry-atlas
It is recommended to use the BOM provided by Micrometer (or your framework if any), you can see how to configure it here. The examples below assume you are using a BOM.
1.1. Gradle
After the BOM is configured, add the following dependency:
implementation 'io.micrometer:micrometer-registry-atlas'| The version is not needed for this dependency since it is defined by the BOM. |
1.2. Maven
After the BOM is configured, add the following dependency:
<dependency>
  <groupId>io.micrometer</groupId>
  <artifactId>micrometer-registry-atlas</artifactId>
</dependency>| The version is not needed for this dependency since it is defined by the BOM. |
2. Configuring
AtlasConfig atlasConfig = new AtlasConfig() {
    @Override
    public Duration step() {
        return Duration.ofSeconds(10);
    }

    @Override
    public String get(String k) {
        return null; // accept the rest of the defaults
    }
};
MeterRegistry registry = new AtlasMeterRegistry(atlasConfig, Clock.SYSTEM);
Micrometer uses Netflix’s Spectator as the underlying instrumentation library when recording metrics destined for Atlas. AtlasConfig is an interface with a set of default methods. If, in the implementation of get(String k), rather than returning null, you instead bind it to a property source, you can override the default configuration. For example, Micrometer’s Spring Boot support binds properties prefixed with management.metrics.export.atlas directly to the AtlasConfig:
management.metrics.export.atlas:
    # The location of your Atlas server
    uri: http://localhost:7101/api/v1/publish

    # You will probably want to conditionally disable Atlas publishing in local development.
    enabled: true

    # The interval at which metrics are sent to Atlas. The default is 1 minute.
    step: 1m
3. Graphing
This section serves as a quick start to rendering useful representations in Atlas for metrics originating in Micrometer. See the Atlas wiki for a far more complete reference of what is possible in Atlas.
3.1. Counters
Atlas serves up graphs in the form of PNG images (and other output formats as well).
We use the following query to visualize the counter from Atlas. Note that the value is rate-normalized over the step interval rather than monotonically increasing. Atlas always expects rate-aggregated data for counters from Micrometer.
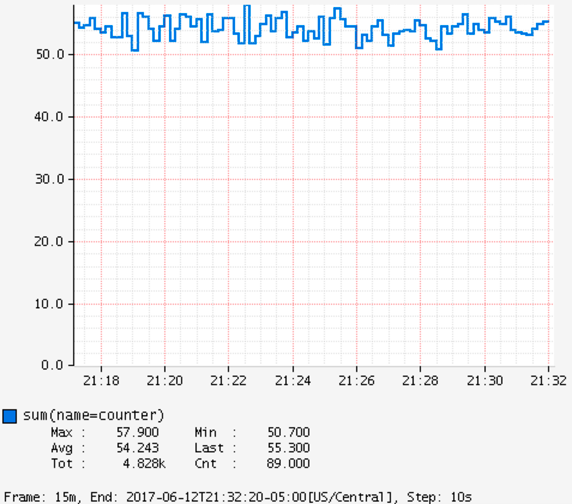
GET /api/v1/graph?
       q=
       name,counter,:eq,
       2,:lw
       &tz=US/Central
       &s=e-15m (1)
       &w=400 (2)
       &l=0 (3)
Host: localhost:7101| 1 | The range of time we want to visualize along the x-axis. e represents the end time or “now”. This graph’s axis is from 15 minutes ago until now. Atlas automatically chooses the finest grained step interval available from the data that would render at least 1px wide on the resultant image. |
| 2 | The overall width of the PNG image returned should be 400px. |
| 3 | Set the y-axis lower limit to 0 so that random perturbation in the walk does not look so dramatic. |
3.2. Timers
While reading directly from a Timer returns a double, the underlying value is
stored in Spectator as a nanosecond-precise long. What precision is lost by
converting to a double in the Timer interface does not affect a system like
Atlas, because it has been configured to read measurements from the underlying
Spectator Timer that Micrometer is hiding from you.
The Spectator Atlas Timer produces four time series, each with a different statistic tag:
-
count: Rate of calls per second. -
totalTime: Rate of total time per second. -
totalOfSquares: Rate of total time squared per second (useful for standard deviation). -
max: The maximum amount recorded.
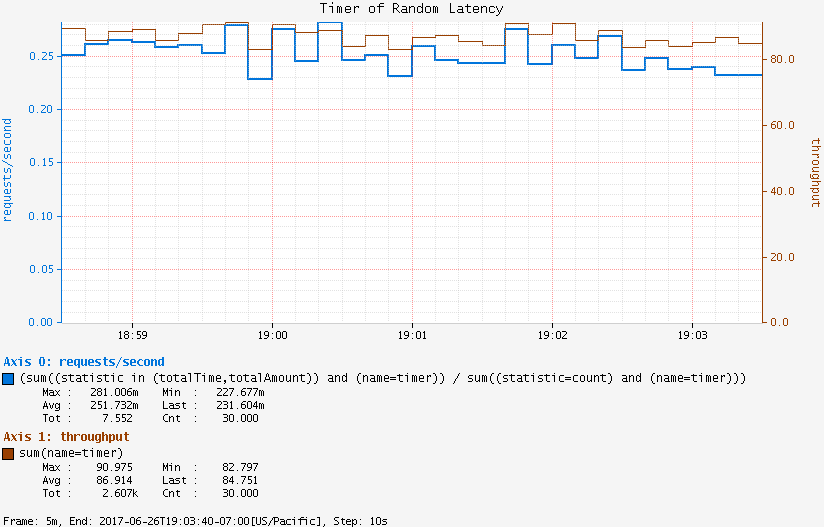
Therefore, you can achieve a throughput (requests/second) line with the following query:
name,timer,:eq,statistic,count,:eq,:andNotice that statistic is just a dimension that can be drilled down and selected like any other.
Furthermore, totalTime/count represents average latency and can be selected with a short-hand :dist-avg query, which selects the totalTime and count time series and performs the division for us:
name,timer,:eq,:dist-avgIn the preceding example, you can see these two lines plotted on a single dual-axis graph.
3.3. Long Task Timers
Suppose we had a task that took two minutes to complete when it was expected to complete in less than 70 seconds. A key benefit of long task timers is the ability to receive an alert at the first reporting interval after we have exceeded the threshold. With a regular timer, we would not receive an alert until the first reporting interval after the process completed. If we had a ten-second publishing interval, the regular timer alert would arrive almost a minute after the long task timer alert.
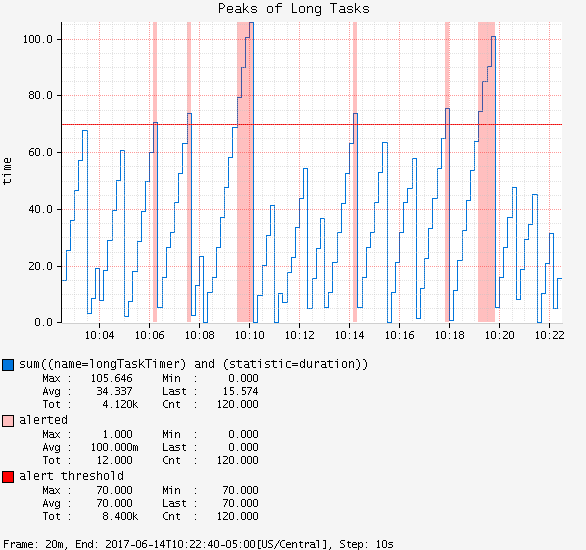
GET /api/v1/graph?
       q=
       name,longTaskTimer,:eq,statistic,duration,:eq,:and, (1)
       :dup,
       70,:gt,:vspan,f00,:color,40,:alpha,alerted,:legend, (2)
       70,f00,:color,alert+threshold,:legend (3)
       &tz=US/Central
       &s=e-15m
       &w=400
       &l=0
       &title=Peaks+of+Long+Tasks
       &ylabel=time
Host: localhost:7101| 1 | A representation of long tasks that are happening back-to-back. |
| 2 | A vertical span that appears whenever the long task exceeds our threshold of 70 seconds. So that it does not overwhelm the graph, we also decrease the opacity of the vspan. |
| 3 | Plot the threshold of 70 seconds as a separate line. |

