|
For the latest stable version, please use Micrometer 1.16.4! |
Micrometer Humio
Humio is a dimensional time-series SaaS with built-in dashboarding.
1. Installing
For Gradle, add the following implementation:
implementation 'io.micrometer:micrometer-registry-humio:latest.release'For Maven, add the following dependency:
<dependency>
  <groupId>io.micrometer</groupId>
  <artifactId>micrometer-registry-humio</artifactId>
  <version>${micrometer.version}</version>
</dependency>
2. Configuring
The following example configures a Humio instance:
HumioConfig humioConfig = new HumioConfig() {
    @Override
    public String apiToken() {
        return MY_TOKEN;
    }

    @Override
    @Nullable
    public String get(String k) {
        return null;
    }
};
MeterRegistry registry = new HumioMeterRegistry(humioConfig, Clock.SYSTEM);
HumioConfig is an interface with a set of default methods. If, in the implementation of get(String k), rather than returning null, you instead bind it to a property source, you can override the default configuration. For example, Micrometer’s Spring Boot support binds properties that are prefixed with management.metrics.export.humio directly to the HumioConfig:
management.metrics.export.humio:
    api-token: YOURKEY

    # You will probably want disable Humio publishing in a local development profile.
    enabled: true

    # The interval at which metrics are sent to Humio. The default is 1 minute.
    step: 1m

    # The cluster Micrometer will send metrics to. The default is "https://cloud.humio.com"
    uri: https://myhumiohost
3. Graphing
This section serves as a quick start to rendering useful representations in Humio for metrics originating in Micrometer.
3.1. Timers
The Humio implementation of Timer produces four fields in Humio:
-
count: Rate of total time/second. -
sum: Rate of calls/second. -
max: A sliding window that shows the maximum amount recorded. -
avg: A non-aggregable average for only this set of tag values.
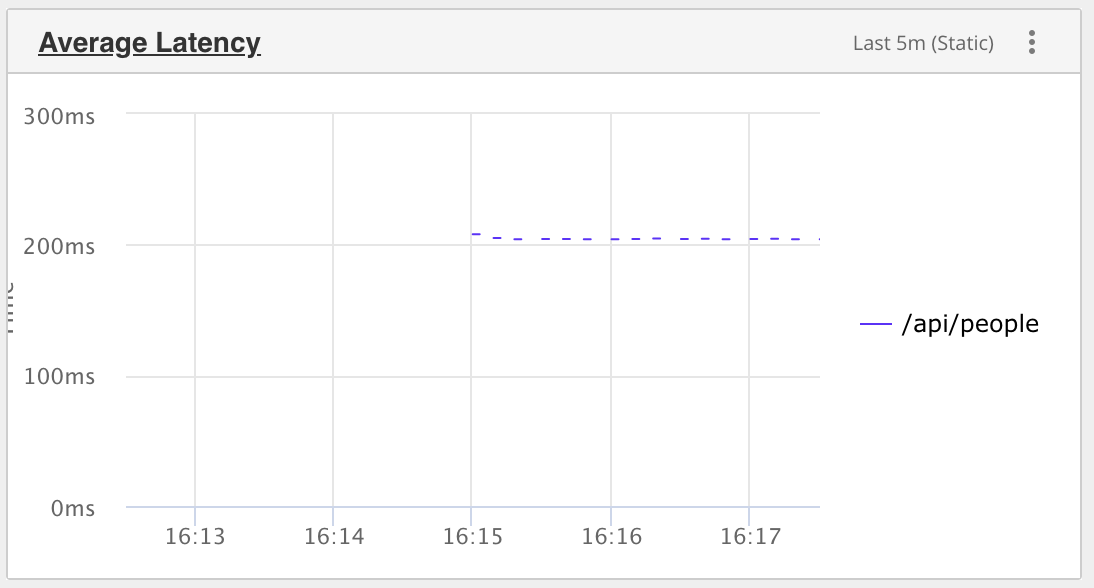
The following query constructs a dimensionally aggregable average latency per URI:
name = http_server_requests
| timechart(uri, function=max(avg))

