|
This version is still in development and is not considered stable yet. For the latest stable version, please use Micrometer 1.16.3! |
Micrometer Humio
Humio is a dimensional time-series SaaS with built-in dashboarding.
1. Installing micrometer-registry-humio
It is recommended to use the BOM provided by Micrometer (or your framework if any), you can see how to configure it here. The examples below assume you are using a BOM.
1.1. Gradle
After the BOM is configured, add the following dependency:
implementation 'io.micrometer:micrometer-registry-humio'| The version is not needed for this dependency since it is defined by the BOM. |
1.2. Maven
After the BOM is configured, add the following dependency:
<dependency>
  <groupId>io.micrometer</groupId>
  <artifactId>micrometer-registry-humio</artifactId>
</dependency>| The version is not needed for this dependency since it is defined by the BOM. |
2. Configuring
The following example configures a Humio instance:
HumioConfig humioConfig = new HumioConfig() {
    @Override
    public String apiToken() {
        return MY_TOKEN;
    }

    @Override
    @Nullable
    public String get(String k) {
        return null;
    }
};
MeterRegistry registry = new HumioMeterRegistry(humioConfig, Clock.SYSTEM);
HumioConfig is an interface with a set of default methods. If, in the implementation of get(String k), rather than returning null, you instead bind it to a property source, you can override the default configuration. For example, Micrometer’s Spring Boot support binds properties that are prefixed with management.metrics.export.humio directly to the HumioConfig:
management.metrics.export.humio:
    api-token: YOURKEY

    # You will probably want disable Humio publishing in a local development profile.
    enabled: true

    # The interval at which metrics are sent to Humio. The default is 1 minute.
    step: 1m

    # The cluster Micrometer will send metrics to. The default is "https://cloud.humio.com"
    uri: https://myhumiohost
3. Graphing
This section serves as a quick start to rendering useful representations in Humio for metrics originating in Micrometer.
3.1. Timers
The Humio implementation of Timer produces four fields in Humio:
-
count: Rate of total time/second. -
sum: Rate of calls/second. -
max: A sliding window that shows the maximum amount recorded. -
avg: A non-aggregable average for only this set of tag values.
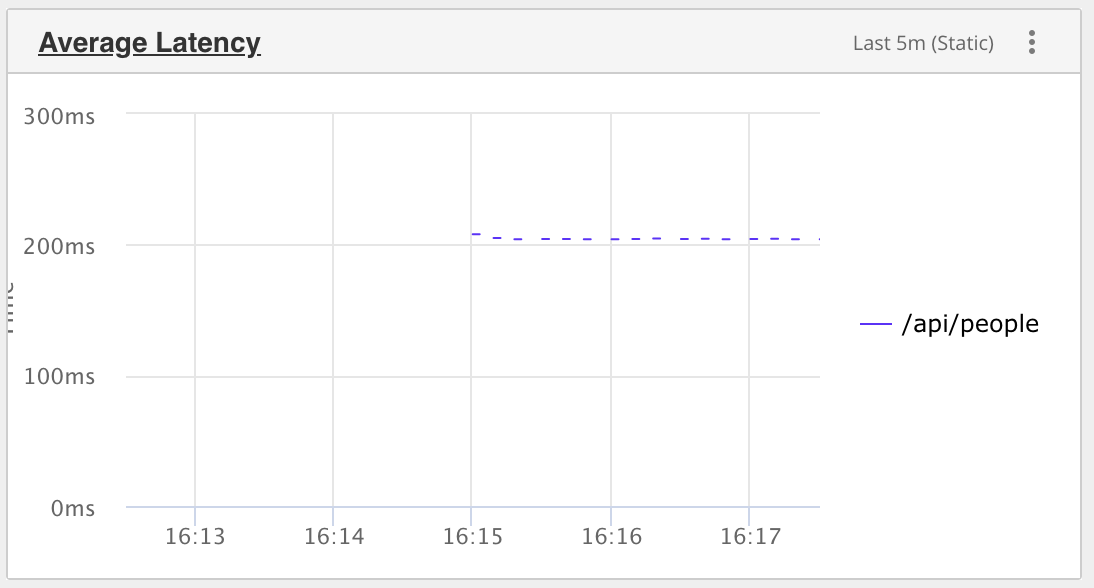
The following query constructs a dimensionally aggregable average latency per URI:
name = http_server_requests
| timechart(uri, function=max(avg))

