Glossary
Micrometer Tracing contains a core module with an instrumentation SPI, a set of modules containing bridges to various tracers, a set of modules containing dedicated span reporting mechanisms, and a test kit. You need to understand the following definitions for distributed tracing:
Micrometer Tracing borrows Dapper’s terminology.
Span: The basic unit of work. For example, sending an RPC is a new span, as is sending a response to an RPC. Spans also have other data, such as descriptions, timestamped events, key-value annotations (tags), the ID of the span that caused them, and process IDs (normally IP addresses).
Spans can be started and stopped, and they keep track of their timing information. Once you create a span, you must stop it at some point in the future.
Trace: A set of spans forming a tree-like structure.
For example, if you run a distributed big-data store, a trace might be formed by a PUT request.
Annotation/Event: Used to record the existence of an event in time.
Tracer: A library that handles the lifecycle of a span. It can create, start, stop, and report spans to an external system via reporters / exporters.
Tracing context: For distributed tracing to work, the tracing context (trace identifier, span identifier, and so on) must be propagated through the process (for example, over threads) and over the network.
Log correlation: Parts of the tracing context (such as the trace identifier and the span identifier) can be populated to the logs of a given application. One can then collect all logs in a single storage and group them with a trace ID. That way, you can get all logs, for a single business operation (trace) from all services put in a chronological order.
Latency analysis tools: A tool that collects exported spans and visualizes the whole trace. Such a tool allows easy latency analysis.
The following image shows how Span and Trace look in a system.
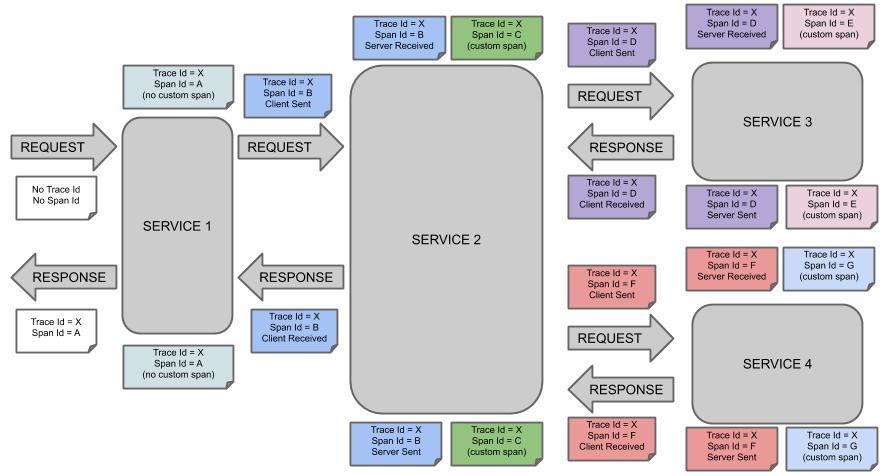
Each color of a note signifies a span (there are seven spans - from A to G). Consider the following note:
Trace Id = X
Span Id = D
Client Sent
This note indicates that the current span has Trace Id set to X and Span Id set to D.
Also, from the RPC perspective, the Client Sent event took place.
Let’s consider more notes:
Trace Id = X
Span Id = A
(no custom span)

Trace Id = X
Span Id = C
(custom span)
You can continue with a created span (example with no custom span indication), or you can create child spans manually (example with custom span indication).
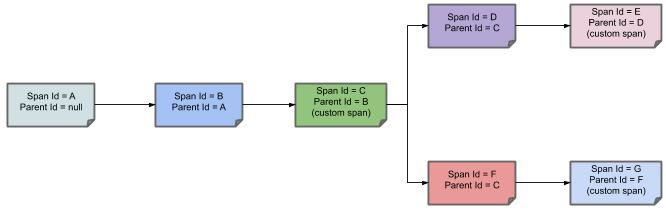
The following image shows how the parent-child relationships of spans look: